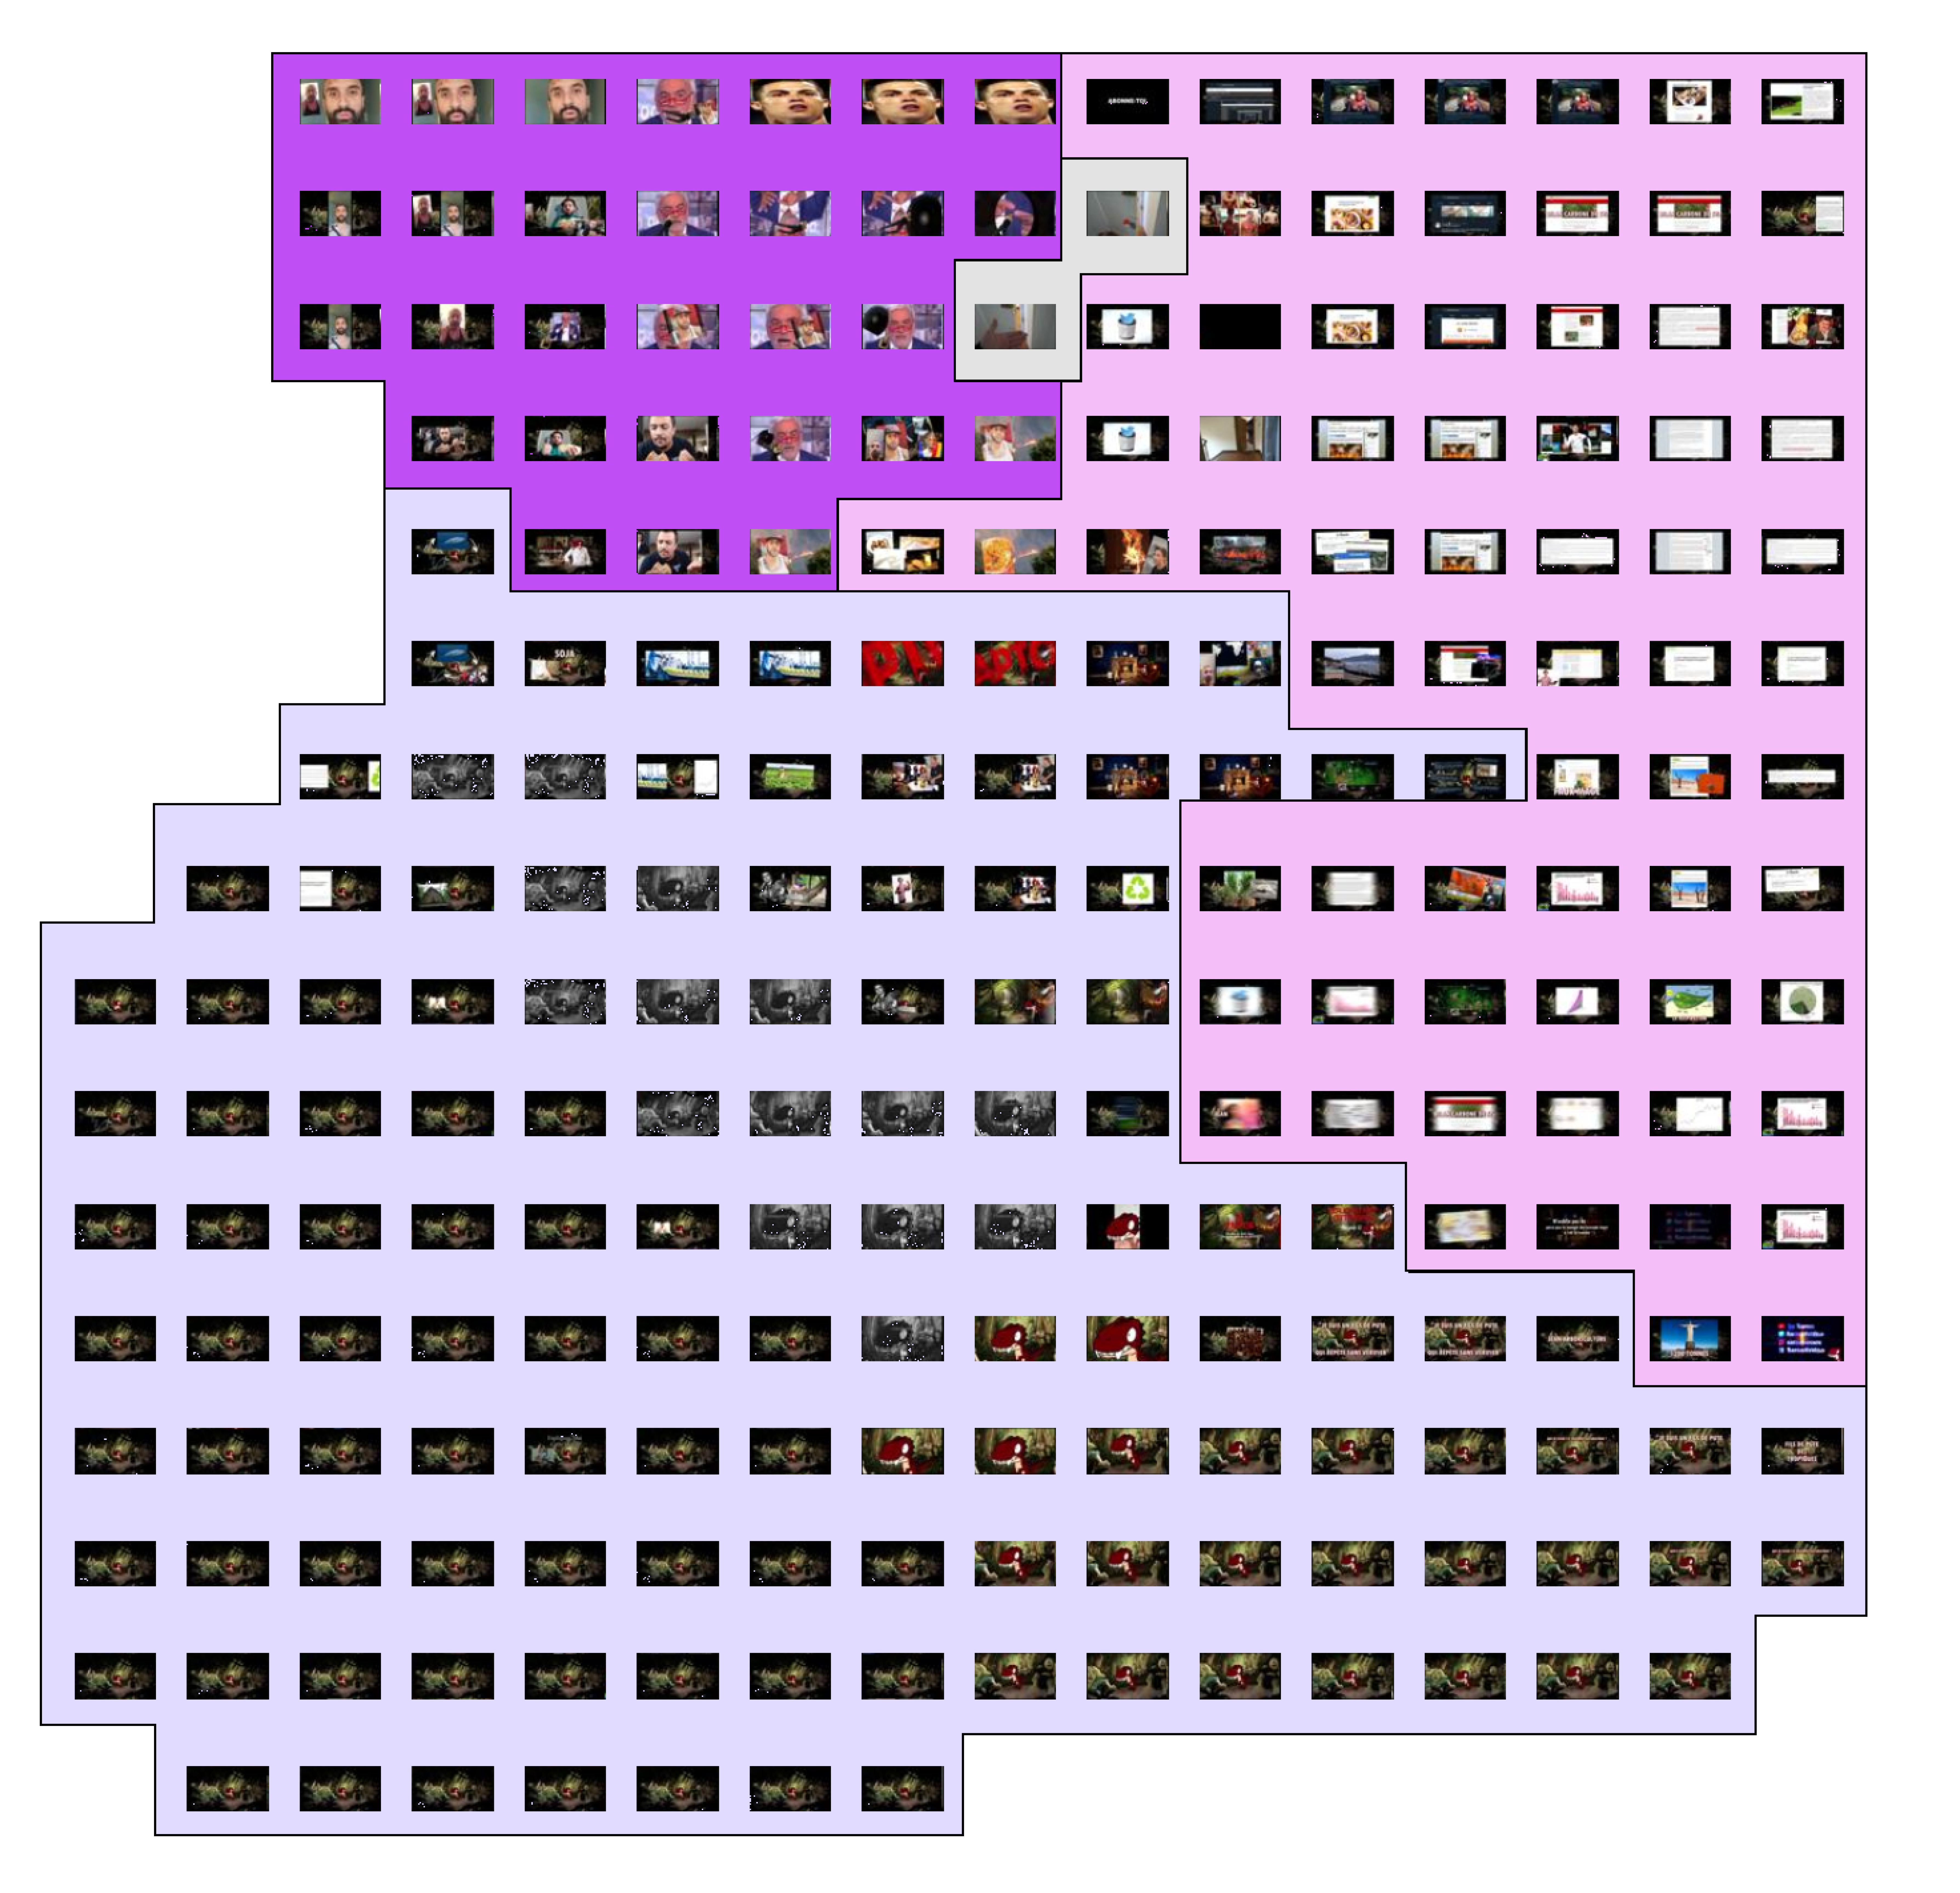
Visualising main themes in each video to compare the content of two collections of videos.

RQ: How are themes distributed in each Amazon Fires related Youtube?

VISUALIZATION

STEPS
WHAT’S IT FOR
TOOLS
DETAILS AND MATERIALS
SCRAPING
DATA EXPLORATION
DATA PREPARATION
URLS CREATION
RENAMING THE NEW COLUMN
DOWNLOAD VIDEOS
COLLECTING VIDEOS IN A NEW FOLDER
FRAME EXTRACTIONS BY CHANGE OF SCENE
COLLECTING ALL FRAMES IN THE FOLDER OF THE VIDEO THEY BELONG TO
CREATION OF A VECTOR SPACE WITH ALL THE FRAMES OF A SINGLE VIDEO AT ONCE
CHOOSE THE VIEW ON PIXPLOT
EXPORT THE VISUALISATION
ANNOTATE THE VISUALISATION
GET A LIST OF VIDEOS FOR EACH CHOSEN QUERY AND SELECTED TIME-FRAME.
OPEN THE YOUTUBE DATA TOOL(YDT) CSV DOWNLOADED AND EXPLORE THE DATA.
FILTER THE LIST BY ORDER OF VIEWS TO TAKE THE FIRST 10 VIDEOS AS SAMPLES FOR EACH QUERY.
INSIDE THE YDT.CSV THERE IS ONLY THE VIDEOS ID, BUT YOU NEED THE URL TO DOWNLOAD THEM.
TO KEEP TRACK OF THE NEW COLUMN IN WHICH WE HAVE ALL THE VIDEO URLS.
DOWNLOAD THE VIDEO SAMPLE QUICKLY AND AUTOMATICALLY.
IT’S IMPORTANT FOR THE NEXT SCRIPT THAT THE FOLDER CONTAINS ONLY THE DOWNLOADED VIDEOS.
* THE SCRIPT EXTRACTS THREE FRAMES EVERY SCENE CHANGE.
THE DETECT.PY SCRIPT CREATES A SUBFOLDER FOR EACH VIDEO IN WHICH IT INSERTS ALL THE DETECTED FRAMES.
YOU MUST LAUNCH ONE PIXPLOT AT A TIME FOR EACH FRAMES FOLDER TO ORGANISE THEM BY THEIR VISUAL SIMILARITY.
FOR THIS METHOD CHOOSE THE VIEW:CLUSTER IMAGES BY UMAP DIMENSIONALITY REDUCTION ON A GRID.
TAKE A SCREENSHOT OR USE THE "SAVE AS" COMMAND TO OBTAIN A STATIC IMAGE ON WHICH TO MAKE ANNOTATIONS.
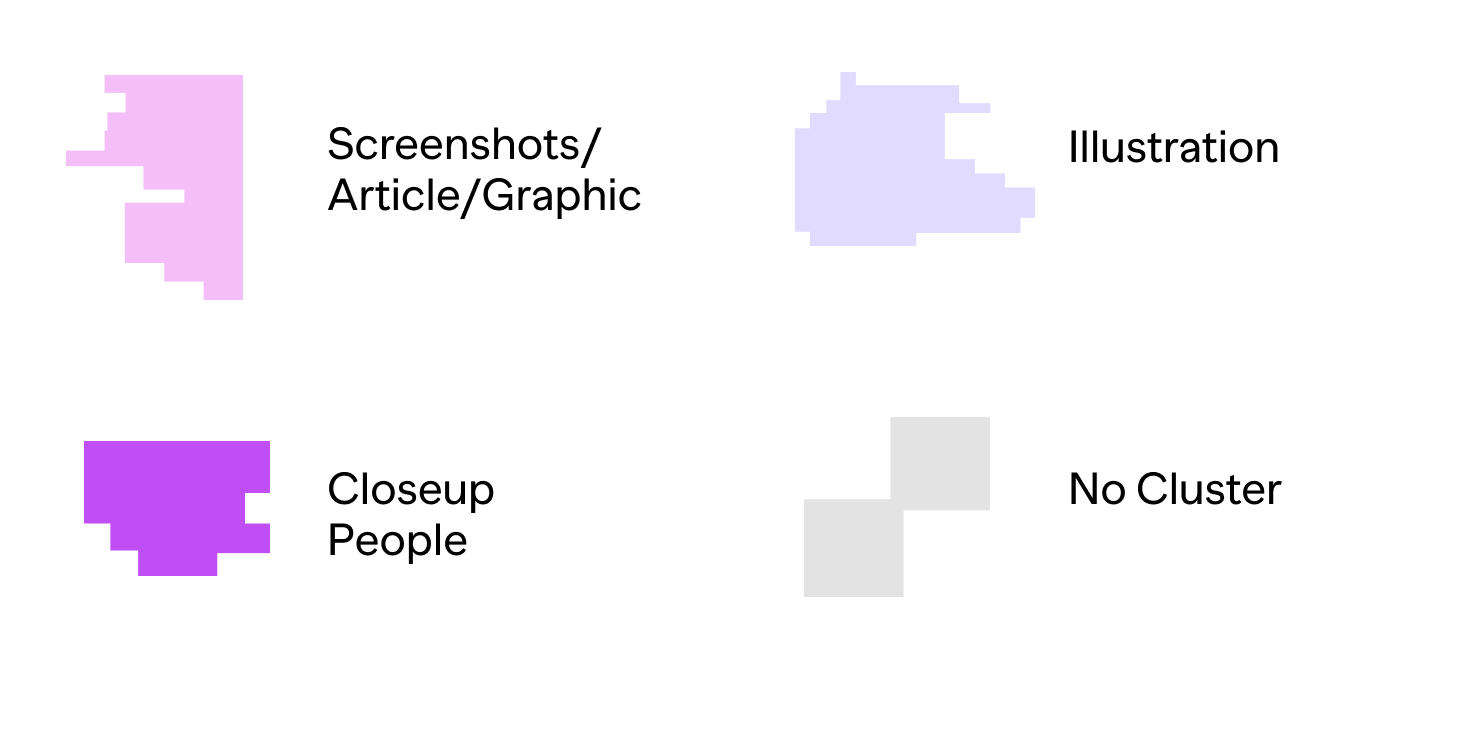
HIGHLIGHTING THEMATIC CLUSTERS.
Youtube Data Tools[Video List]
Excel[Import Data]
Excel[Filter-Discending]
Excel=CONCATENA(E2;F2)
Excel
Python 3[PyTube3]
No tool needed
Python 3[PySceneDetect]
No tool needed
Anaconda + Python3 + Pixplot
Pixplot
Pixplot
Figma
“Amazon Fires” - “Pray for Amazonia”
videoIdvideoTitlepublishedAtviewCountposition

E2 ⟩ http://www.youtube.com/watch?v=

F2 ⟶ videoId

videoUrl

LINK TO PYTHON3 DOCUMENTATION

LINK TO PYTUBE3 DOCUMENTATION

LINK TO REPOSITORY AND STEP-BY-STEP GUIDE

Rename the videos inside the folder like this:

vid1vid2vid3vid4

LINK TO PYSCENEDETECT DOCUMENTATION

LINK TO REPOSITORY AND STEP-BY-STEP GUIDE

Rename the frames inside the folder like this:

frame1frame2frame3frame4frame5

LINK TO INSTALL ANACONDA

LINK TO PIXPLOT DOCUMENTATION

LINK TO REPOSITORY AND STEP-BY-STEP GUIDE

LINK TO DOWNLOAD FIGMA

METODOLOGY

aim

In this type of analysis, we move from an overview of the frames in the whole collection to a view of the frames for each video. The aim is to be able to compare the contents of two collections of videos based on the thematic clusters found in each video. Frame extraction for this purpose is based on scene change detection, so that the images to be analysed are only taken once and there are no duplicates due to scene length. All frames of a video are analysed with Pixplot and arranged in a UMAP grid based on their visual similarity. The different thematic clusters in each grid are highlighted with colour areas using Figma.

output

The final visualisation consists of a series of matrices representing the videos, where the thematic components that are discussed in the video are represented with different colours.. This type of visualization allows a summary comparison of the thematic contents among the videos of two different collections.