Identifying and visualising the main themes emerging from a video collection of videos.

RQ: Which are the main themes (based on number of scenes) in the Amazon Fires related YouTube videos?

VISUALIZATION

Responsive image
Responsive image
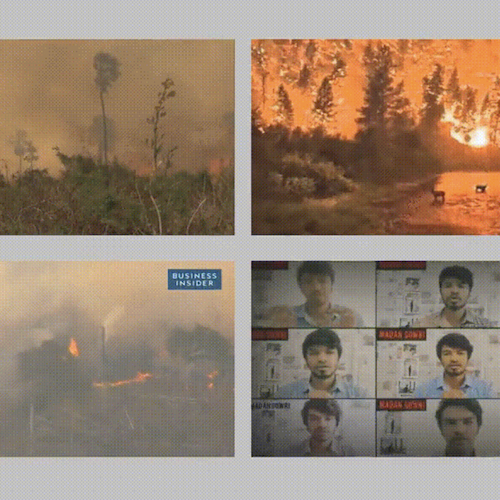
MONTAGE
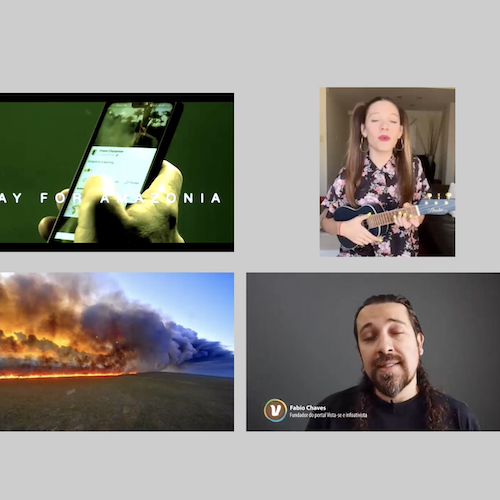
GRID
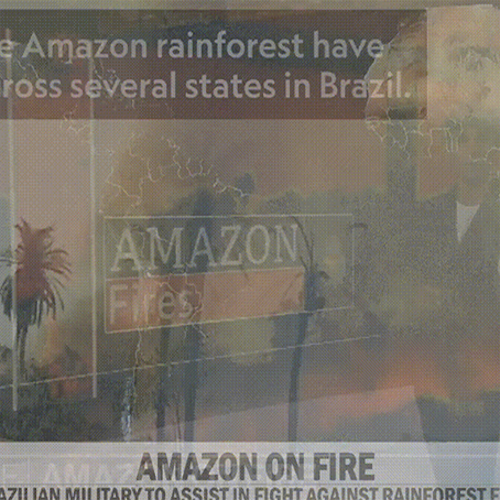
01 - MONTAGE AMAZON FIRES

SET VIDEOS:

01 ENTENDA O DESMAMENTO | 02 AMAZON RAINFOREST ON FIRE | 03 AMAZON FOREST ODHYSCIENZE | 04 AMAZON FOREST FIRE WHAT IT TELL ABOUT DEFORESTATION | 05 DRONE FOOTAGE REVEALS AFTER MATH OF AMAZON FIRES

DURATION:

00:03:27

VIDEO OPACITY:

40%

STEPS
WHAT’S IT FOR
TOOLS
DETAILS AND MATERIALS
SCRAPING
DATA EXPLORATION
DATA PREPARATION
URLS CREATION
RENAMING THE NEW COLUMN
DOWNLOAD VIDEOS
CREATING A NEW PROJECT AND IMPORT ALL VIDEOS FOR EACH QUERY
CREATING THE MONTAGE
EXPORTING THE NEW VIDEO
GET A LIST OF VIDEOS FOR EACH CHOSEN QUERY AND SELECTED TIME-FRAME.
OPEN THE YOUTUBE DATA TOOL(YDT) CSV DOWNLOADED AND EXPLORE THE DATA.
FILTER THE LIST BY ORDER OF VIEWS TO TAKE THE FIRST 5 VIDEOS AS SAMPLES FOR EACH QUERY (AMAZON FIRES-PRAYFORAMAZONIA)
INSIDE THE YDT.CSV THERE IS ONLY THE VIDEOS ID, BUT YOU NEED THE URL TO DOWNLOAD THEM.
TO KEEP TRACK OF THE NEW COLUMN IN WHICH WE HAVE ALL THE VIDEO URLS.
DOWNLOAD THE VIDEO SAMPLE QUICKLY AND AUTOMATICALLY.
THIS STEP CAN BE REPLICATED USING ANY FREE VIDEO EDITING TOOL EVEN INCLUDED WITHIN THE OPERATING SYSTEM
YOU MUST SET THE OPACITY OF EACH VIDEO TO 40% IN ORDER TO HAVE THE OVERLAY EFFECT
EXPORT AS H264 WITH AUDIO INCLUDED TO PRESERVE THE SOUND COMPONENT
Youtube Data Tools[Video List]
Excel[Import Data]
Excel[Filter-Discending]
Excel=CONCATENA(E2;F2)
Excel
Python3[PyTube3]
Premiere[Import]
Premiere[Opacity: 40]
Premiere[Export as H264]
“Amazon Fires” - “Pray for Amazonia”
videoIdvideoTitlepublishedAtviewCountposition

E2 ⟩ http://www.youtube.com/watch?v=

F2 ⟶ videoId

videoUrl

LINK TO PYTHON3 DOCUMENTATION

LINK TO PYTUBE3 DOCUMENTATION

LINK TO REPOSITORY AND STEP-BY-STEP GUIDE

LINK TO DOWNLOAD

METODOLOGY

aim

This method aims to identify which are the main themes emerging within a collection of videos. Frame extraction for this purpose is based on scene change detection, so that the images to be analysed are only taken once and there are no duplicates due to scene length. The layout used to arrange the frames according to their visual similarity is offered by Pixplot, which uses UMAP projection, a dimensionality reduction algorithm, specifically designed for visualising complex data in low dimensions (2D or 3D).

output

The final visualisation is a clusterisation of frames sorted by visual similarity that allows the identification of predominant thematic clusters within the analysed video collection. The thematic annotations of the visualisation were drawn following the boundaries identified by the original Pixplot visualisation.